Phase Fraction Contour Diagram for Ti64
Purpose: Learn to calculate and plot phase fraction contour diagram in a multi-component system. In this example, a contour diagram is calculated and plotted for an isopleth in the Ti-Al-V-N-O five components system.
Module: PanPhaseDiagram
Thermodynamic Database: PanTi.pdb(this database is a thermodynamic database for multi-component titanium alloys which is only available to users who have licensed it.)
Calculation Procedures:
-
Load PanTi.pdb following the procedure in Pandat User's Guide: Load Database ;
-
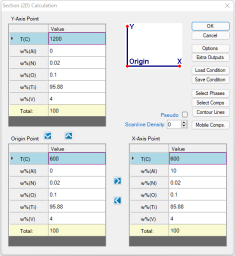
Perform a Section Calculation from PanPhaseDiagram, and set the calculation condition as shown in Figure 1;
-
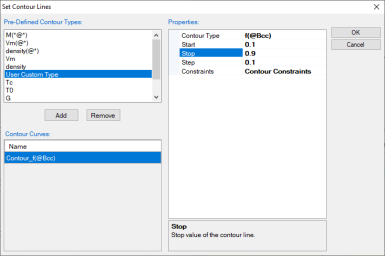
Click “Contour Lines” in the dialog shown in Figure 1, then set the Contour Type as shown in Figure Figure 2;
Post Calculation Operation:
-
Change graph appearance following the procedure in Pandat User's Guide: Property;
-
Label the graph following the procedure in Pandat User's Guide: Icons for Graph on Toolbar;
-
Label each line by putting the cursor on each line and wait for the tool tip to pop out, then press F2;
Information obtained from this calculation:
-
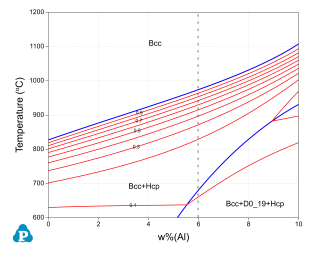
Figure 3 shows the isopleth Ti-Al-4V-0.1O-0.02N (wt%) with contour lines of fractions of the b phase. It clearly shows how the fraction of the b phase varies with temperature and composition. This plot provides a guidance on the selection of alloy composition and heat treatment condition if certain fraction of b phase is needed in the microstructure;
-
For Ti64 (6 wt% of Al as indicated by the black dash line), the fraction of b phase (and a phase) in the a+b two-phase structure can be read from the contour diagram directly given a heat treatment temperature;


